
Episode 3: The Network's No. 1 Law - the Power Law
- Asaf Shapira
- Apr 10, 2021
- 30 min read
Updated: Nov 20, 2021
What's the rumpus.
I'm Asaf Shapira and this is NETfrix.
The Power Law distribution is perhaps the most basic but awesome phenomenon in networks. We met the Power Law in the previous episode and, as advertised, this episode will dig deeper on the subject and broaden our understanding of it and most importantly: how can it help us in life?
This episode will consist of two parts:
Part one will serve as an introduction to explain what is a Power Law and why the Power Law is not intuitive. We'll give lots of examples to show that the Power Law is all around us and deal with the implications of the Power Law in real life. The second part will focus on Power Law in networks, but also why is there a Power Law? What stands behind this phenomenon? And of course, as a climax: How does understanding the Power Law helps us in network analysis?
As we said in the past, network analysis is associated, among others, with the field of statistics, and the Power Law is part of it. So first, we need to prepare to the journey we're embarking on by reminding ourselves that the field of statistics is not intuitive.
For example, I remember arguing with a friend for 4 hours about the famous Monty Hall problem:
This problem is named after a TV game show host which during the show presented the participant with 3 curtains. Behind one of the curtains there was a valuable prize, say a goat with a bell, and behind the other 2 curtains there was nothing. The participant's goal was to choose which curtain to unveil, in order to win what's behind it.
Suppose the participants chose curtain No. 1. Then the host (who knew where the goat was) unveiled curtain No. 2 to show that there was nothing behind it. Then he turned to the participants to ask if they decide to stay with their original choice or switch their choice to curtain No. 3.
According to our intuition, what should the participants do? Stay or switch? I'll make an educated guess and say that most of us are not born & raised statisticians. That's why most of us aren't aware of the world of distributions, but I guess we all know this one: The Normal Distribution. That's because Normal distribution is our bedrock for many of our intuitions. It's also known as a bell distribution for its bell shape, or a Gaussian distribution or a Poisson. It's a lot of names for one distribution and it sounds suspicious. Makes one wonder if it's trying to hide something. But most of us let it off the hook because it's normal.
What could go wrong with normal?
Another appealing feature that contributes to the overall popularity of the normal distribution is "the average" or "mean".
For example, as we send our beloved 3.8-feet-tall children to first grade, we will not have to worry that they will be surrounded by giants or that the chair they will be sitting on will be too small. That’s' because according to the Ministry of Health's statistics, 3.8' is the average height for their age. There will be some shorter kids and some taller, but the majority will be approximately the same height.
And that's why people like averages. The concept of average makes life much simpler. Though just a single number, we feel it tells us the story behind most of the data.
This presenter is not a statistician or a social psychologist, but in my subjective opinion, most of us perceive the world via normal distribution: we see some extreme cases at one end of the scale and some at the opposite end, but the majority tends to populate the middle grounds. And this sounds normal.
Political opinions are an excellent example of a normal distribution:
We have extremists on both sides, but the majority rallies toward center-parties and we have election results to prove it.
But what if instead of looking at political views we'll look at political actions? For example, participating in demonstrations.
Suddenly, we see a shift and we get a Power Law distribution.
We talked about it a bit in the previous episode, but let's give a brief reminder of what a Power Law is.
The Power Law distribution is named after the equation it stands for that contains a power ("power" in the mathematical sense) which will make the graph non-linear.
Now enough with the formalities. Let's try a more visual way to picture how a Power Law graph should look like and compare it to a normal graph.
The following example is dedicated to those of us who are not growing up but are just getting older:
If a normal distribution looks like a boa constrictor digesting an elephant, then a Power Law graph will look like a Brachiosaurus.

Brachiosaurus, as my dear son explained to me, was the largest dinosaur in the world and had a straight, long neck like a giraffe, and a very long tail. If we picture the Brachiosaurus on a chart, the head and neck will represent a few tall columns on the left, and the long tail that follows will represent many short columns that spread along most of the X-axis. The child also noted that the Brachiosaurus is vegetarian and cute and therefore it will be widely referred to in this episode. Now back to politics. So, contrary to political views, which are a normal distribution, political actions like demonstrations, are a Power Law distribution. Now let's take a moment to think about it: In how many of the demonstrations that have taken place in the world in recent years have we participated in? If the answer is between 0 and 2 you should not feel bad. Most people prefer to demonstrate indifference.
But alongside quiet apathy lane, there will be a tiny but very prominent minority of serial protesters that will frequently appear on the news, shouting through a megaphone and probably suffer from a broken voice the next morning.
So, if we'll put the population on the X-axis and sort by political opinions, from left to right (pun intended), we'll get a few short columns on the far left and a few short columns on the far right. The high columns will be in the center of our graph. But what if we'll put the same population on a chart but this time will sort by the amount of times they've participated in demonstrations, from most to least? What will happen is that we'll get a few tall columns on the left indicating high participation in demonstrations which will be the dinosaur's head. The rest of our graph will look like a long tail consisting of very short columns, indicating low participation level or none. When we do act, it's thanks for the persistence of those inhabiting the dinosaur's head.
As early as the beginning of the 20th century, several examples of Power Law distribution were reported (although called by other names). For example, Felix Auerbach, who was a physicist, discovered a century ago that the population distribution in cities is a Power Law: The largest city will be twice as large as the second largest city and three times as large as the third largest city, and so on. So if we turn the cities' population to columns on a graph and sort by size, we will see a few very tall columns that represent major cities (the dinosaur head) and a lot of small columns that represent small settlements that make up the "long tail".
Sounds dubious? I commend the skeptics among us for their skepticism, but I have got to refer them to the Central Bureau of Statistics to watch the Power Law in action:
Let's take Israel as an example of a law-abiding country (Power Law abiding, that is):
As of 2018, Jerusalem, which is the biggest city in Israel, has about 920,000 residents, which is twice as much as Tel Aviv, which has about 450,000, and three times as much as Haifa, which has about 280,000 residents.
If you're thinking to yourself – those crazy Israelis and their crazy statistics - check out New York, Chicago, Houston and so on. The more you go on, you'll get roughly the same results. Why roughly? And why it was a physicist that discovered this?
In order to understand why, you'll have to bear through yet some more examples.
A slightly later example is Zipf's law. George Zipf is considered the father of computational linguistics and as early as the 1930's he formulated a similar law concerning the prevalence of words in a book. The law states that the most common word will appear in a book twice as much as the second frequent word, three times more than the third frequent word and so on. In fact, it can be said that half of each book consists of just a hundred or two hundred words and the rest of the book consists of words that will be repeated only once or twice. Those seldomly-used words form the "long tail" of the distribution. This is the reason a simple word count in a text to understand what it is about is a bit naïve, cause most of the common words will probably be non-indicative conjunctions.

But the most significant, and lesser-known achievement of Zipf was that his interns applied his word count research on James Joyce's book "Ulysses". That's why Zipf holds the record for the one who made the most students finish this book. Not a trivial accomplishment.
But perhaps the most prominent area where we detect a Power Law is in the field of economics. The hope of those striving for economic equality is shattered time and time again by the fact that few people hold majority of the capital. A classic Power Law. That's why the Power Law serves as one of the metrics in the "Gini Index" or so-called "Inequality Index" that is used in comparative economics. The "Gini Index" is the score of the distance between the actual distribution of wealth, which is Power Law, and a uniform distribution, which is a flat line in graph representing absolute equality, meaning everyone has the same amount of wealth. The bigger the distance score on the "Gini index", the further society is from equality.
Location or traffic data, which has many applications, is also a good example of Power Law:
It may not sound very intuitive, but airport routes are a Power Law. There are few major airports that depart to many destinations (LAX, La Guardia, etc.) but most airports in the world have only few destinations.
This creates a graph with few tall columns of airports with many destinations and a long tail of airports with a single destination.
Let's take another example from location and traffic data: Most of the destinations of the citizens of Israel are.... well... in Israel. Let's put it on a graph: On the X-axis will put side by side all the countries in the world, representing possible destinations for Israelis, while the Y-axis will represent the destination's frequency. What will get is a very tall column for Israel and the rest – a long tail of short columns. You can encounter Israelis in many parts of the world, whether you like it or not, but take comfort in the fact that what you're seeing is just the long tail.
The traffic destinations of most city dwellers are also mostly within the city itself, leaving a long tail of destinations outside the city that city folk seldom go to, say, their parents' house in the suburbs.
If we'll crank up the resolution of the data in order to watch individual's behavior, we'll find out that there are about two places in which the person spends most of the time, usually their home and the workplace, and a long list, or tail, of many other places in which the person spends just a small amount of time.
Note that you can tilt this graph and still get a Power Law, what does this mean?
Instead of destinations we go to, we can look at distances we travel. And so, we will get one tall column to represent the exotic trip we've made when we were young, adventurous and Covid-free, and many short columns of short movements in our area of residence.
Once in a while, we might fly to a distant destination, but most of our movements are short and on foot.
The Power Law is also manifested in nature as we can see in the distribution of earthquakes, rivers flow, interaction between proteins in the cell and metabolism of animals. The last one is a function of the animal's size which we have already demonstrated that it conforms to the Power Law.
But back to human society, I think there's something discouraging about the Power Law. By its definition, most of us will find themselves in the "long tail" of the dinosaur and the chances of changing this are not in our favor.
Bizarrely, my kid is very talented, but looking at other people scores on a computer game can discourage him. Game scores are unfortunately a Power Law and what is the chance that he will get a result that even comes close to the No. 1 ranking player? That’s why I was happy to find out that there is at least one area where I'm at the top of the dinosaur.
My wife is a librarian in the largest municipal library in the country. In the annual statistics that the library publishes each new year, it turned out that my wife took out the largest number of books from the library. As you can guess, the majority took only a book or two and formed the long tail. So, how does it relate to me? Well, someone also needs to return all the books my wife took out, so that probably makes me the number one book returner in the country.
So how does understanding the Power Law contribute to us?
If we're already using real-life examples, then the first thing that pops up to me is shelves. When we moved to our new apartment, which contained about 40 shelves for clothes. I told my spouse that I forsake my half of shelf-space in advance and that she can take over all the shelves. I promised her that I would only use two shelves (which of course were located at a strategic and convenient location. I gave up my half, didn't I?). Not surprisingly, it turned out that my wife also uses only 2 shelves most of the time and the rest of the shelves are being used seldomly or never. This is how statistics engineered a long-lasting peace in our home. Understanding the Power Law also helps us to encourage engagement in gaming. We mentioned a moment ago that it is discouraging to see records of other gamers that we will never reach. An important thing to remember about Power Law is that in order to see it in our data, we need a sufficient sample. If we sample only the heights of first graders, for example, we get a normal distribution. If we look at the heights of all creatures on Earth, from whales to bacteria, we get Power Law, as we saw in the "Small World" episode. The more we sample, the more our data will converge to a Power Law distribution.
So, as a complementary, the more we reduce the sample we get a normal distribution and records that we are more likely to break. For example, if we only see the results of those who are close to us, like our friends, or even better, reduce the sample size to include only ourselves, we will increase our motivation to play because we will get records that are easier for us to break.
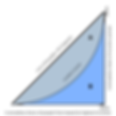
Another example: When we want to understand what our chances are of succeeding in the business world of startups, then it is already a known fact that only 1% of startups become a unicorn, that is, raising lots of money, and the other +90% are the long tail, having a mild or no success at all. And speaking of "long tail" in the business world, we must mention Chris Anderson, who in 2004, published an article that later became a book called "The Long Tail" and introduced the concept to popular culture, and is also the one behind this picture:

Anderson's argument was that there was money to be made in the "long tail" of products. He argued that a wide variety of niche products, each of which sold little on its own, would amount eventually to a large sum of money.
This claim was based on the newly developed digital stores, where the size of goods was almost irrelevant. This made it easier to own niche products that together made up a significant portion of the market.
One example given in this book is a comparison between the digital Amazon and Barnes & Noble, a chain of bookstores in the physical world. 30% of Amazon's sales in 2008, according to the book, were of books that were not held by Barnes & Noble (which held about 100,000 books). Barnes & Nobles did not hold these books because they were too niche and therefore did not have the economic viability to hold them. This means that the long tail of niche books was responsible for 30% of sales on Amazon.
But there are a few problems with the ideas that come up in the book:
Drop-shipping, or the ability to sell products the digital store owner doesn’t own, seems to strengthen Anderson's claim, but it still needs some maintenance and marketing and of course – there's competition. And indeed, small business owners at Amazon find themselves trampled by Amazon's own products.
Another problem in the book is Anderson's claim that technological global trends help to "fatten" the long tail and make niche products more profitable. What he doesn't mention is that the same trends also serve those already empowered by the Power Law. For example, increasing access to the Internet undoubtedly makes it easier to reach niche products, but at the same time, makes it easier to get popular products as well.
But despite all that I have said, if you are over the age of 40 and remember what a DVD is then the book will provide a fun toilet reading.
So, we learned that contrary to our intuition, many things in life are Power Law. But it's not over. Now let's stretch our intuition a little more and talk about what the Power Law does to the concept of "average" that we've discussed about early on.
We have seen that the concept of "average" or "mean" in a normal distribution serves us well and tells us what's what in the data, for example, the average height of humans allows us to build chairs in mass production.
The same goes for average's cousins - the "standard deviations". They can tell us what are the outliers in our data.
But if our data is distributed into a Power Law (and it is distributed into a Power Law), then what does "mean" mean?
Let's imagine an office with 30 employees earning between $ 3,000 and $ 6,000 a month (in a normal distribution). When suddenly, a billionaire enters the office, who earns $ 100 million a month.
Suddenly, the distribution of salaries becomes a Power Law and the average salary of the occupants of the room rises above $ 3 million.
Which of the figures in the office does this average represents? no one.
The use of the mean in a normal distribution stems from the assumption that its numeral value helps to describe most of the data but that's not the case in a "long tail" distribution. In such a distribution, the vast majority will be below average and a few well above it.
Most of us do not share offices with billionaires but do share nationality with them. When calculating the average salary in the country, keep in mind that our data is not normally distributed.
In this context, I remember a news article in 2019 about the struggle of employees from a big bank in Israel to raise their wages. One of the reporters lashed out at one of the employees saying they have nothing to complain about because their average salary is over 9,000$. The low-level employee denied this and replied that no one who works with him earns such a high salary. Without taking sides, just knowing the problematic nature of average, gives weight to the employee's claim. How do we know that the CEOs' salary has not weighted on the average and significantly inflated the result?
A frequent example given for the inappropriate use of averages and standard deviations in a Power Law distribution can be found in cities size. If cities were normally distributed, New York with its 8.5 million inhabitants could not have existed because it is too large for a standard deviation from an average in a normal distribution.
It is impossible to talk about this subject without mentioning the book "Black Swan" by Nassim Taleb. The book is mainly dedicated to two topics:
The first topic that's covered by most of the book, is the genius of Nassim Taleb himself. The second topic is the difference between a normal or gaussian distribution and a Power Law distribution. The book points to common mistakes in analyzing data when using mean and its derivative, the standard deviation.
If we put Taleb's beautiful mind aside for a moment, and focus on his arguments, they touch disturbing issues that concern many of the data science community mainly anomaly detection and forecasts.
Many papers on these topics are based in one way or another on normal distribution, mean and standard deviations.
But since for the most part, the data we rely on is a Power Law, the concept of average does not hold for most of the data and therefore will also impair the results we get using standard deviation. In forecasting, a standard deviation will not be able to predict extreme events as they will be so far from average that they'll seem almost impossible. But in fact, they are more common and constitute a completely normal phenomenon in our Power Law distributed world. Take for example risk assessment against earthquakes which, as already been mentioned, is Power Law distributed, meaning there are many small earthquakes and a few large ones.
Now let's say we succumbed to our intuition and took measures against the average earthquake.
We are likely to encounter a lot of small earthquakes (below average), so in most cases we overshot our use of resources and this would be wasteful. When we'll encounter the big earthquake, which is well above average, will find that we have invested too little resources, and this would be catastrophic. Although big earthquakes are rare, they are more common than the standard deviation tells us and they will happen eventually. Remember- as we increase the sample, meaning in this case we allow more time to go by, the data will reflect the Power Law.
In the next section we will discuss Power Law in networks but wait-
what about the Monty Hall problem from the beginning of the episode?
So as with any argument I had with him, my friend was right.
The answer is that it is better to change the original choice from Curtain No. 1 to Curtain No. 3 where the chances of winning a goat are 2/3.
Intuitive? Not by a long shot.
So, let's talk about Power Law in networks.
The Power Law is not intuitive and so is its application in the field of networks. So, it is no wonder that it hasn't caught the eyes of researchers for a long time.
We should recall that for most of the 20th century, data was limited and as we have already learned, too small a sample of a network would increase the chance of getting a normal distribution and bias in our data. It is therefore not surprising that the way of thinking about networks was via Erdos and Renyi model, which we talked about in the episode "A Small World". The model assumes that networks are random and normally distributed: networks create "messy" structures and therefore it made sense that they were built by random. This notion about networks was kept despite hints that appeared even in the limited data that was available.
A more thorough explanation about those hints can be found in the previous episode, so we will only briefly mention two examples: The first example is that of Jacob Moreno, a psychologist and educator, who in the 1930's drew sociograms of classroom friendships. In the graphs he drew there were a few pupils that many wanted to be their friends compared to many pupils without friends or with only one friend. The number of unpopular pupils was several times greater than the popular ones, making up the long tail of the Power Law. Presumably, if Moreno had drawn a graph of friendships of entire schools, he would have gotten an even longer tail.
The second example is a similar phenomenon that appeared in Stanley Milgram's "Small World" experiment or the "6 degrees" experiment in the 1960's. Milgram set out to find how many steps would a chain letter have to go through from a random source to a random destination, through mutual friends. A lesser known aspect of the experiment was the discovery that almost half of the chains passed through the same 3 people, who made up only one percent of the participants, i.e., few people on the network whose role was significantly bigger than the others, in a Power Law ratio.
The big breakthrough of the Internet and the giant networks (like the World Wide Web) has led to a significant development in the study of networks and to the understanding that the structure of the network is not as random as was commonly thought. In 1999, a paper was published titled: "Emergence of Scaling in Random Network"
Behind this sexy title were 2 researchers (Albert and Barabashi) whose discoveries changed the way we think about networks.
I will take this opportunity to recommend Barabashi's book " Linked ", which is a fascinating and a very easy-to-read book.
So Barabashi and Albert studied links between web pages. What Barabashi has discovered is that there are very few pages on the web that have lots of links, compared to the long tail of web pages that only have one or two links.
Today it is a known fact that most of the internet consists of such pages that have only a few links or none at all, and most of them are in the part of the internet called deep web, which is estimated to contain about 90% of the internet. On a side note, Deep Web is not the same as Dark Web or Dark Net. Deep Web is a technical term for pages that are not indexed by search engines. Only a small part of them constitute the Dark Net which is usually used for shady businesses. The concept of the deep web might already be familiar to many of the on-line community even if they did not think of it as a Power Law but how about our intuitions regarding Facebook, the largest social network in the world?
In recent years I have given hundreds of lectures on the subject and in each lecture, I've conducted a small experiment: I asked for volunteers in the audience and asked them how many friends they have on Facebook. Usually the answer was somewhere between 200 and 2000. Here and there I've found a sinner who did not have Facebook.
The audience's intuition was that those results constituted the average, meaning that most people on Facebook have between 200 and 2000 friends, and there are probably a few who have many thousands of friends and a few who have few friends.
Bottom line – it seemed to them like a classic example of a normal distribution.
When I confronted them with the fact that Facebook is actually a Power Law distribution, meaning there are few people with thousands of friends and the majority of users have probably just one or two friends or no friends at all, the reactions ranged from astonishment to healthy skepticism.
I cannot tell a lie, there were also about two or three who didn't give a duck. By the way, when I say a few people on Facebook who have thousands of friends it is important to remember that this is a network with 2.5 billion active users, yes? So, a few is not so few. I refer to the over-all percentage.
The reason this fact is not intuitive is that we know almost no one from Facebook's 'long tail'. This probably because those people have only one or two friends or have no friends at all, so, what are the odds we'll know them?
Hold on, wait a second! But what about bots or other fake users? Maybe they are the ones who make up the "long tail" and produce an unnatural Power Law?
In order to test this claim, let's take, for example, Ellen Degeneres, the American actress and comedian, with about 150 million followers on social media. An article published in 2019 found that fifty percent of her followers are fake. That's a lot. But she still has tens of millions of followers, most of whom probably don't have many followers.
As we can see, fake profiles might consist a big portion of the long tail, but not enough to call it a fake tail.
And here's another thing: The Power Law is a widespread phenomenon in many types of networks that don’t contain fake users such as biological networks or human networks, organizational and others, So with or without fake nodes, the long tail is alive and well.
If you are still not convinced, then let's reconcile your intuition with the fact that on Facebook 1% post content, 9% reply and 90% post nothing. Does this make more sense? This example of a Power Law is more intuitive because most of us are probably in the 99%. But the logic behind this is the same logic. Only that instead of a distribution of connections, we presented a distribution of network activity.
In the years following Barabashi's paper, many researchers presented empirical studies of networks that reinforced the Power Law theory not only in the context of a distribution of edges in a network, but also found Power Law in all other metrics of networks. As we've seen in the example of Facebook, Not only is the number of friends that the user has is distributed as a Power Law but also the creation of content.
Whether it is the link count for each node or the its activity in the network, the strength of the connections between the nodes or the size of the connected components (or "islands in the network") and more. All these metrics are distributed as Power Law.
But Barabashi discovered something more. Power Law in networks has a fascinating feature and it is that Power Law networks are scale-free. That is, at any scale or resolution we look at the network, we get a Power Law.
What does this mean?
Let us return to the example we gave for a Power Law in the context of analyzing location and traffic patterns:
Even when we scaled up in resolution from world-wide traffic data, going through data at state and city-level up to the resolution of the individual person, in each resolution we got data that is distributed as a Power Law.
This truly amazing characteristic has additional implications that we will explore in the following episodes dealing with communities and dynamic networks.
So, to conclude this section: It does not matter if we explore Facebook, Twitter, a phone network, or connections between sites on the Internet. It does not matter if we analyze a large or small network, a day's or a week's period of network data, a network in routine-mode or a network in crisis-mode. In each case we get a "long tail" distribution, and this is reflected not only in every metric of the network, but also in any resolution we view it.
As can be seen from the examples so far, the Power Law distribution is not limited to networks, but it is such a significant network phenomenon that it earned the title "the Network No. 1 Law ".
Now, let's apply law no. 1 on one of the most controversial networks and that is the Bitcoin network, and see where it takes us:
Bitcoin, for those who have not been here in the last ten years, is a digital currency, and because it's based on a blockchain platform, its transaction data is available to all. Some network scientists jumped on the opportunity and built a bitcoin graph, or network, by assigning edges between traders, and assigning weights to the edges by the size of the transaction. Bitcoin's claim2fame is that it's a social currency. Bitcoin advocates denounce the "fiat", which is the name for currency that is backed up by governments, as a victim to the whims of those governments and central banks. They consider the Fiat as a centralized currency that is controlled by the few in power. Bitcoin, they'll say, is a de-centralized currency, and thus represents the "will of the people".
It's true that our currency's value is affected by governments and central banks but they in turn are affected by other governments and other central banks that are affected by the market and so on and so forth. For better or worse (but probably for the better), this complex system prevents government officials from capriciously deciding on radical currency changes. In some countries, the people can even replace those in charge of it.
In contrast, who runs the show in Bitcoin? According to the brochure, it's the general public, but according to network's law, the story is totally different. Have we mentioned Power Law before? ;)
In practice, a network is a network and Bitcoin is a network. And as with any network - we get a Power Law. So how does this help us understand what's going on there?
The Bitcoin network is not an exception and is dominated by a few accounts that make most of the transactions. At least till 2013, these were very few accounts indeed, that include the Bitcoin exchange, Bitcoin mining companies (from Russia and China) and of course, the gambling industry. Does this fine, but short, list represents "the will of the people"?
Given such a highly concentrated control, can it still be said that Bitcoin is a de-centralized currency?
So, we've seen that human (and human-related) networks are shaped as a Power Law but there are also other networks in nature such as the neural network in the brain and the vascular network that has the same feature. It's not a coincidence and it's certainly not random. So, what's the reason for it? To answer this, we will demonstrate the evolutionary logic behind Power Law and how it benefits the network. Power Law networks have two main advantages which are: efficiency and resilience.
A Power Law configuration is more economical and a good example of this is the road network.
Since most of the traffic is local, the road system within the city is denser and consists of many small and narrow streets or roads.
Traffic between cities is sparser, so in this case, traffic congests to long and wide roads.
We got a Power Law: A few long-distance roads and many short ones.
Any other distribution would be redundant and use up too many resources.
Thus, a star-shaped network, that is, a network with a central junction and all the other nodes are connected only to it, is probably the most efficient network.
But what about network resilience?
Intuitively, a star-shaped network sounds very vulnerable. The whole network is dependent on one central node. Efficiency in Power Law is understandable, but where is the resilience?
Evolutionarily speaking, this network is actually more resilient to random hazards.
A random network, as described by Erdos and Renyi (i.e., a network with a normal distribution) will decompose very quickly to numerous connected components (or "islands" in the network) after a small number of random attacks.
By contrast, in a Power Law network (as real networks are distributed) there is a lower chance for significant damage from random attacks. Why's that? Since central nodes in the network are rare. 99% of the network will be comprised of nodes that have only one or a few edges, so targeting them will inflict only negligible damage to the network as a whole.
That's why our vascular network is a Power Law. Otherwise, any random scratch would bleed much more.
But at the same time, intentional injury to the heart is fatal.
The obvious conclusion is that informed attackers, that afflict intentional damage, can dismantle the Power Law network very easily by targeting the central nodes. That's why understanding the Power Law provides significant advantage for the purposes of network defense or attack.
Take the C-elegans for example. C-elegans is short for a short worm about a millimeter long and is probably the smallest known animal with a neural network. It's entire small set of neurons (about 300) was mapped in a 20-years effort, which won the Nobel prize. In the many studies performed on the C-elegans, damage to neurons in the long tail did not result in significant changes in its behavior. In contrast, damage to a central neuron, which has the most connections to other neurons, had a significant effect on the worm, for example on its ability to move.
In order to locate these central nodes, we will need to use an SNA or Social Network Analysis algorithm, known as "Centrality Measures".
These metrics allow us to find the centers of gravity of the networks and through them "control" the network, understand what is happening in it, strengthen or dismantle it, etc.
There are probably hundreds of algorithms to find these "hubs" in the network, but we will deal with them in the next episode.
So now that we understand the logic behind the Power Law in networks, let's try to explain how it came to be:
We've mentioned Felix Auerbach, who as a physicist a hundred years ago, realized that the size of cities obeys a Power Law. But why did that discovery was originated from the field of physics?
The connection between network science and physics is not trivial, as can attest a physics professor from the University of Jerusalem, who shall remain anonymous. This professor specializes in network research and he used to say:
" How do I know I'm a physicist? When I'm confronted by
my peers in the hallway telling me that what I'm doing is not physics.
If I were a chemist, they wouldn't have been so upset. "
Many of the examples we gave for a Power Law distribution are from human's behavior perspective (network behavior, population dispersal in cities, traffic habits or use of shelves) but there are many examples that are not conditioned by human behavior for example, earthquakes, river flow, animal size, blood vessels, neurons in the brain, Protein interactions and more.
So, this begs the question: When we see a Power Law in human networks, is it a result of human behavior or of the nature of physics?
If the Power Law stems from human behavior, human behavior might change one day, and abolish the Power Law. But physical laws are supposed to be a bit more rigid. If the Power Law is a law of physics, then do we as human beings have a free-choice? Isaac Asimov, perhaps the most famous Science Fiction author, presented in his series "The Foundation" an organization that conducts psycho-historical research which is a field made up by Asimov that has the ability to predict the future based on the statistical nature of the behavior of the masses.
Admittedly this scenario is too Si-Fi'ish, but the Power Law, as we have seen, allows for pretty good predictions of human behavior and data. There are more physical laws that manifest in human society and they are studied in the field called Social physics.
This field uses those laws to test their application to society.
So, if we are controlled by physic principals, do we have free-choice or don't we?
If you kept reading, it means you have no choice so we will continue.
Barabashi's conclusion from his groundbreaking research was that the reason for the Power Law is that networks are built according to a Preferential Attachment model. It means that an edge is not randomly created between two nodes but that nodes prefer to connect to the more connected nodes. The intuitive explanation for this is the saying "The rich get richer" since it is easier for those who have capital - economic or social - to obtain additional capital and in the case of the network, more edges or connections. This can explain the dinosaur's head, as we called it or the creation of hubs in our network.
A possible physical explanation for the long tail of the Power Law is that just as a flow seeks the way of least resistance, so are the ones in the "long tail" spend minimum energy as a default, much like in the "default bias" concept:
Our default is usually to do nothing. When we do act, it is easiest for us to do what others do (for example, connect to a central hub) and thus invest the minimum required energy.
For example: there are many things I do not know but my default mode urges me to sit and keep watching Netflix and stop searching for answers online. When I have no choice and I have to look-up something, then it's easier for me to look it up in Wikipedia than to do independent research, because that's what everyone else does.
FYI, if we're on the subject of Wikipedia, then the contribution to Wikipedia is also a Power Law, of course. There will be few who will contribute to many Wikipedia values and the majority will contribute to only a few values or not contribute at all.
Now let's refer to the example given at the beginning of the episode regarding the difference between political opinions and political demonstrations:
Opinions do not tax our energy and are distributed normally. Participation in a demonstration requires effort and energy and therefore will be Power Law distributed. Our default is not to participate.
This also explains the mild results in Milgram's experiment, which we've mentioned in the previous episode. Milgram was somewhat aware of this attitude toward non-participation, so he took measures to encourage participation. First, he acted to recruit particularly sociable people to take part in the experiment by appealing to them through newspaper ads that targeted this section of the population.
Second, he invested heavily in the design of the envelopes he sent to potential participants. For example, he used official Harvard University's envelopes and included impressive-looking notebooks so that potential participants will feel that they are taking part in a respectable academic endeavor and will be encouraged to take part in it.
Despite Milgram's efforts, the end-result of the experiment was that the vast majority of chains didn't reach the target and were mostly broken or did not even start. But apparently thanks to the novelty of the research and his efforts, it was probably the highest success rate such an experiment had or will have. All the remakes or copycats of Milgram's experiment (including yours truly) barely crossed the single percent of successful chains, if any. That's because for the majority of the potential participants, the default is not to participate. So back to Barabashi's Preferential Attachment idea – something is missing in this model. The problem with saying "the rich get richer" is that it does not explain why there are cases where "the rich get poorer" or vice versa. This is where Dr. Ossi Mokryn from the University of Haifa enters the picture, whom in recent years has proposed her hypothesis of The Temporal Preferential Attachment (or TPA). Her hypothesis states that nodes prefer to attach to "trendier" nodes, rather than central nodes (or hubs). "Trendy" nodes refer to a node that has been gaining more links recently, even if it is not necessarily the most linked node at the time
The empirical study was done on many varied networks, while controlling, in a statistical sense, the initial centrality of the nodes in the network. What does this mean?
Simply, each network was divided to numerous time segments, or bins, while ignoring the centrality of the nodes in the first segment. Mokryn's observation was that the more connections were added to the node, the more likely it would increase its chances of receiving more connections in the next segment, regardless of its initial centrality.
We can see that network centrality is dynamic, and those who were central in the past will not necessarily be central in the future. A trend begins, ends and can also make a comeback (as in life...).
The thing that makes this hypothesis a potentially powerful discovery is that it seems to be a new and universal network law and therefore applicable to any network.
TPA seems to be a promising direction that will make it possible to identify emerging trends in the network, for example, the formation of centers of gravity or network activities.
Another possible application to the TPA model is to identify the rhythm (or tempo) of the network: Dr. Mokryn's study also showed that there are networks in which the trends change all the time and there are those in which the rate of turnovers is slower. The tempo of the network can help us to analyze the dynamics of the networks but will discuss this in much more detail in the episode dedicated to dynamic networks.
One final word before summing-up:
The discovery of the magical features of the Power Law in networks, has made this concept a slightly charged word in network science:
About 20 years after Barabashi's discovery, a network researcher named Clauset published a paper criticizing the general use of the term Power Law. Using empirical research, he has demonstrated that many networks show only "weak signs" of a true Power Law distribution. This paper ignited a heated debate on Twitter and shocked at least ten people around the world (:
I therefore suggest not to get too excited about this because the discussion can be summed up as follows: a "pure" Power Law distribution is indeed a relatively rare event. If we'll check up-close the predictions made by Auerbach about cities size, for example, we'll discover that the magical multiplication relationship between the columns won't last long. The first 3 largest cities will probably abide to a pure Power Law, but the others probably won't. But it's still close to a Power Law, and that's enough. Why? Because all the features mentioned in this episode will also appear in distributions that are close to a Power Law. For example, even if they are not "pure" Power Law, all networks are scale-free, and of course, they exhibit the "long tail" of the distribution, i.e. there are a few hubs in the network that are highly linked and most of the network consists of nodes that have but a few edges. It's clear that "long tail distribution" is a more accurate term than "Power Law ", but Power Law has already caught on so we will use both terms and I hope Clauset won't find it offensive.
So, let's conclude:
We delved into the concept of the Power Law and demonstrated it on many datasets. We have seen that it is a significant reoccurring phenomenon in every network, and in every metric or dimension of the network. We've seen that the Power Law produces centers of gravity or hubs in the network, and we analyzed the logic behind it and the possible reasons for its formation.
We have seen that Power Law and network laws allow the researcher to make good predictions and take a data-driven approach that has the advantage of being independent of intuition or prior experience and free from prejudice.
Now that we understand that every network has gravity centers, thanks to the Power Law, we will learn in the next episode how to find them using Centrality Measures. Did you enjoy, and want to share? Have you suffered and you do not want to suffer alone?
Tell your friends or rate us here. Thank you! Much appreciated! The music is courtesy of Compile band. Check them out! See you in the next episode of NETfrix (: #Network_Science #SNA #Social_Network Analysis #Graph_Theory #Data_Science #Social_Physics #Computer_Science #Statistics #Mathematics #Social_Science #Physics #Facebook #Podcast